What is this? This newsletter aims to track information disorder largely from an Indian perspective. It will also look at some global campaigns and research.*
What this is not? A fact-check newsletter. There are organisations like Altnews, Boomlive, etc. who already do some great work. It may feature some of their fact-checks periodically.*
Welcome to Edition 20 of MisDisMal-Information
Farmers and CBI Unfolding
Note: This section contains a lot of images. So if you have image rendering blocked in your mail client (I do!), then I would recommend clicking through and viewing it in a browser. I’ve also tried to use vertical image where possible because, apparently, I only just realised that people read email on their mobiles 🤦♂️
Ok, let’s dive in. For this edition, I was determined to look at compare behaviour across trends that were engaging in competing, or at least, unrelated narratives. So as I was getting started, the hashtag CBIUnfoldSSRMystery was trending among the top 3, and another hashtag IStandWithIndianFarmers was just breaking in with around 35K tweets.
Starting with the CBIUnfoldSSRMystery hashtag first.
I extracted around 40K tweets, which was around a quarter of the tweets associated with it as per Twitter.
Around 11000 unique tweets.
~ 7000 accounts participated.
First, I looked at a distribution of tweets by time (in UTC). As you can see, it is pretty consistent, which is not too surprising since I caught it around what was probably its peak.

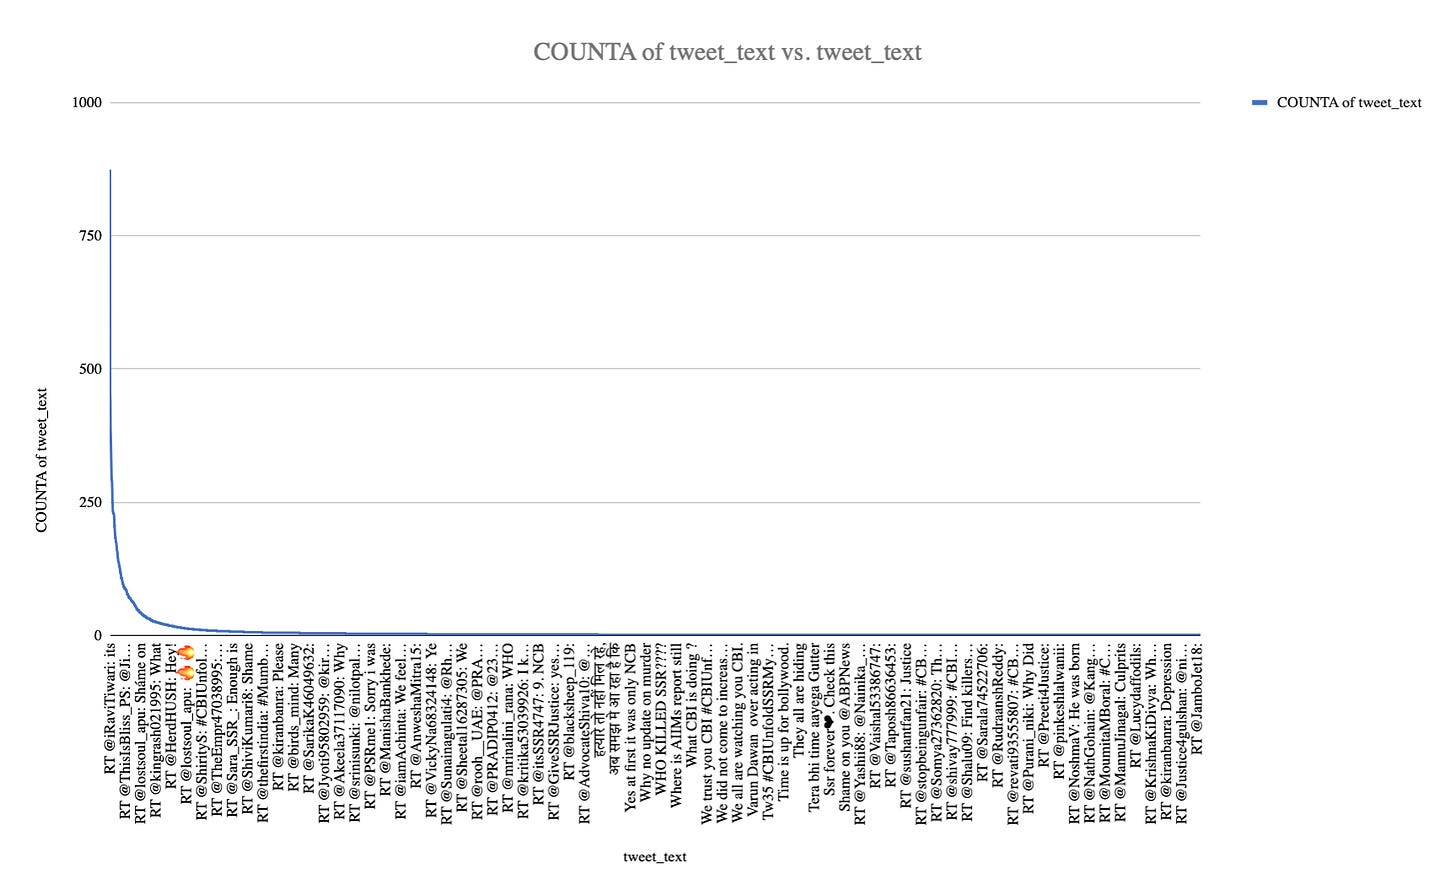
Second, I looked at the relative popularity of the tweets. If you’re a regular reader, then that pattern will look familiar. These included calls to move the focus from drugs back to ‘only SSR’, not to forget since that’s what the ‘culprits are waiting for’, claims about CBI FIRs, questions about the Maharashtra Government.
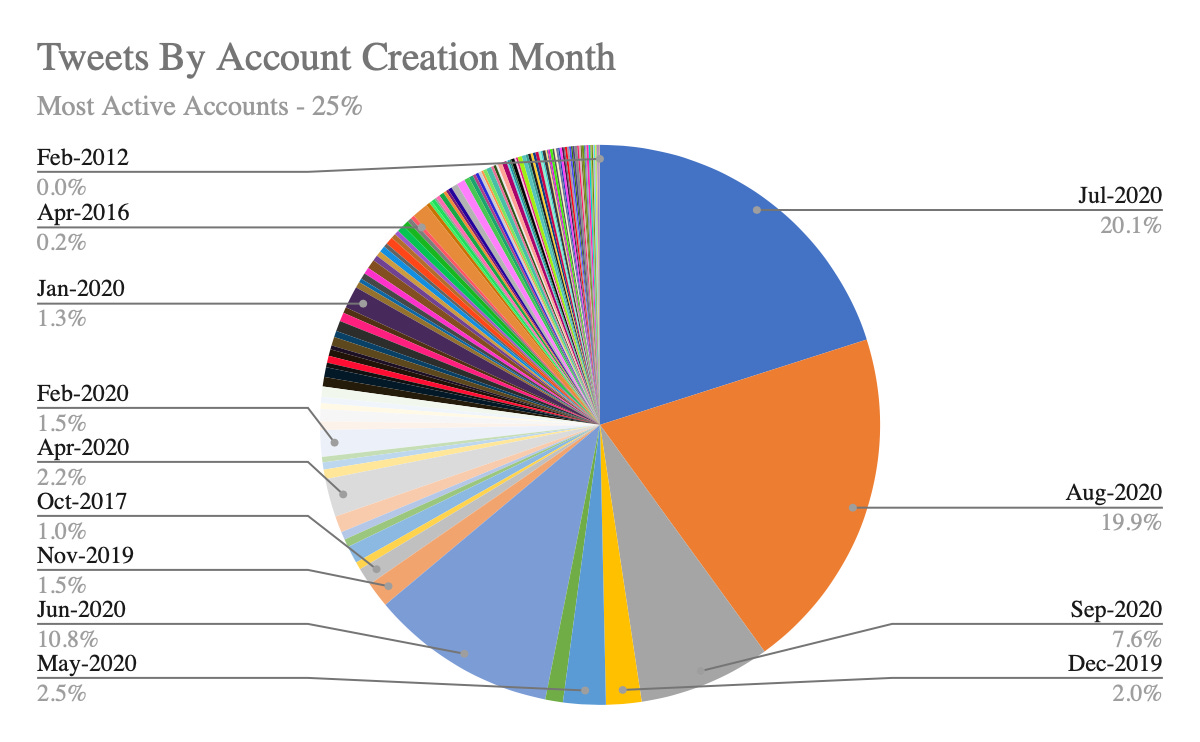
Then, I looked at the distribution of tweets (including retweets) by account creation month.
All Accounts: ~45% of the tweets were from accounts created in Jul, Aug and Sep 2020.

1% most active accounts: ~60% from accounts created in Jul, Aug and Sep 2020.

10%, 25% and 66% most active accounts: ~45 - 50% from accounts created Jul-Sep 2020.


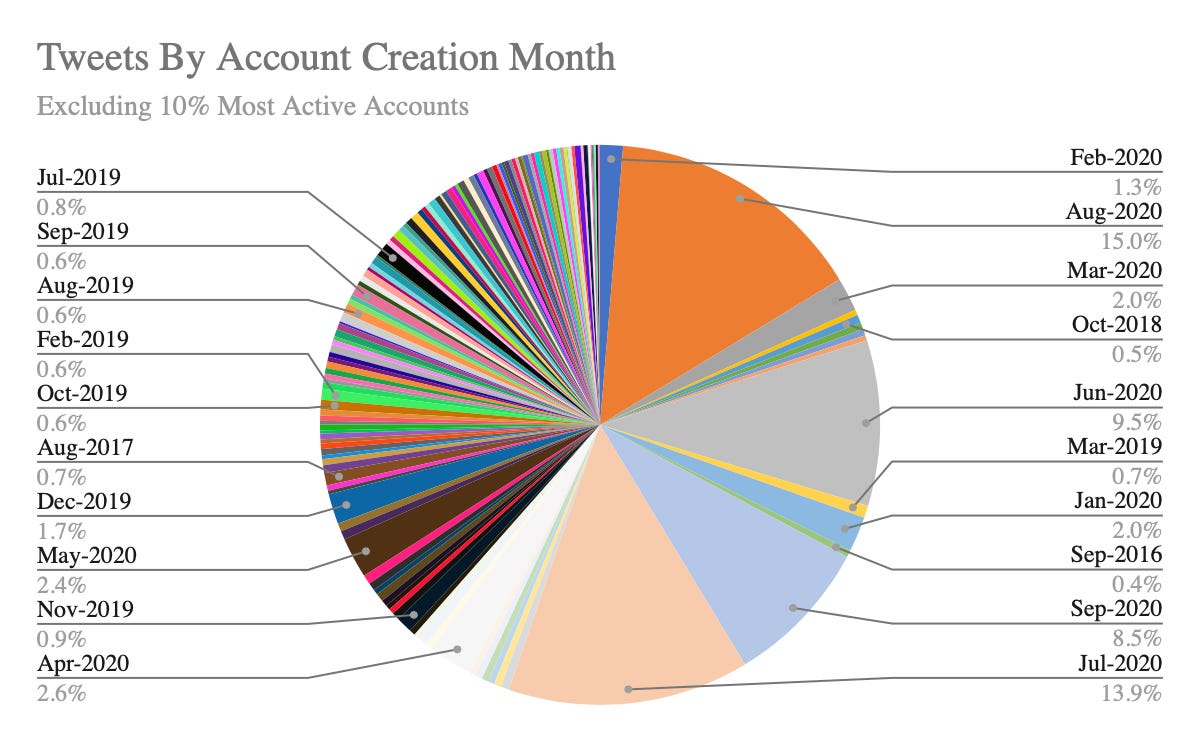
I also find it helpful to look at this after excluding the 10% most active accounts. ~40% still were from accounts created in the last 3 months.
I also generated a cloud of hashtags that were used alongside CBIUnfoldSSRMystery. There were references to Jiah Khan, a ‘cleanup’ and ‘drugsfreeindia’.

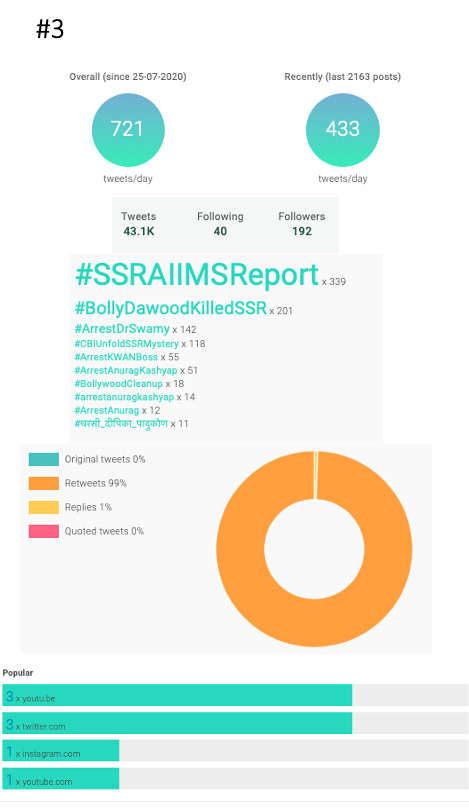
9 of the top 10 accounts either had display pictures of Sushant Singh Rajput or mentioned him in their account descriptions (2 of these were created before 2020). For now, let’s focus on the top 5. These are all recently created accounts. Hashtag activity (based on the sampled tweets) indicate a lot of activity around the SSR case. Most of them mainly RT other content. And activity ranged from ~150 tweets/day to over 1000.




Now, let’s repeat this with the IStandWithIndianFarmers hashtag and see what similarities or differences we find.
I extracted around 37K tweets against the 40K I tried. That’s probably all there were at the time.
Around 8200 unique tweets.
~ 12K accounts participated.
Looking at the time distribution, you can probably see the exact moment where it took off.

Looking at the most RT-ed tweets. The most popular tweet was the same one that led to the trend taking off around 12:10 PM on 24th September.

Now, to the distribution of tweets (including retweets) by account creation month. And let’s use the same yardstick as the previous hashtag.
All Tweets: ~22% of tweets from accounts created in Jul, Aug and Sep. Note though, that the relative position of Sep has reversed.
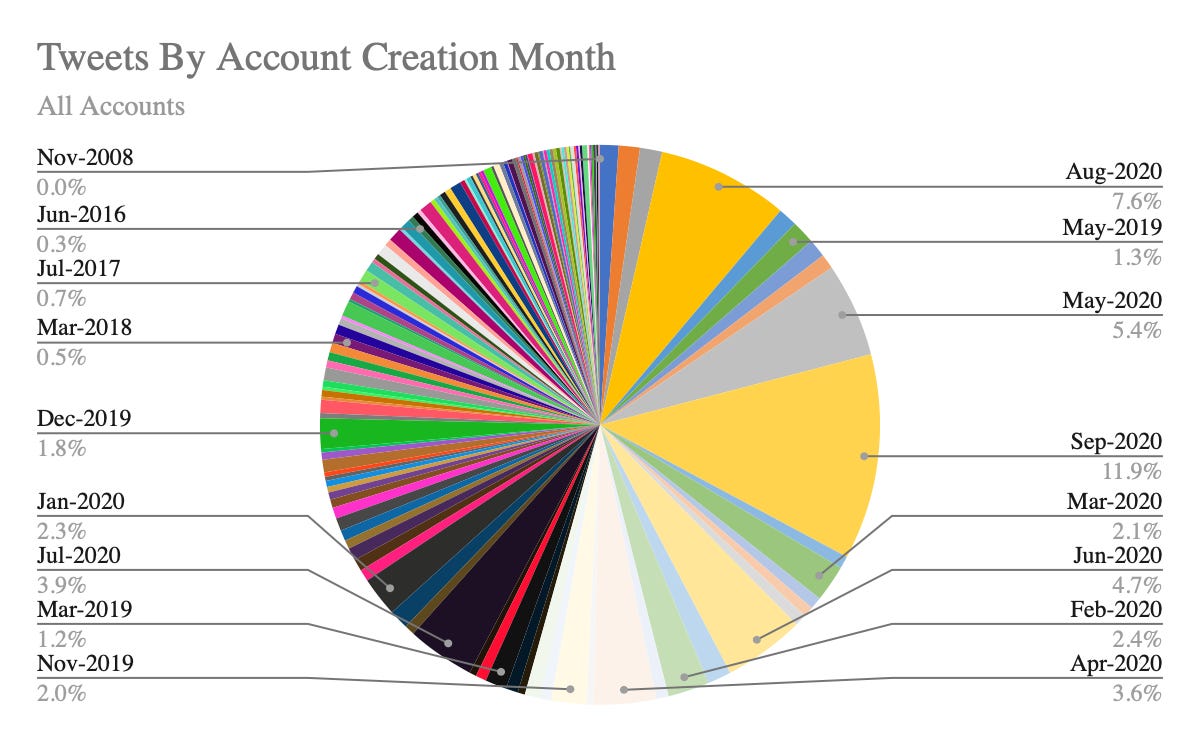
1% of most active accounts: 31% of tweets from accounts created in Jul-Sep 2020. Again, to note that September accounted for a bulk of these.

10%, 25% and 66% of the most active accounts: In all three cases, the combination of Jul-Sep accounts hovered at around 24%. Same situation with September.


When excluding the 10% most active accounts, the share of Jul-Sep accounts dropped to 18%. Most of this reduction was due to September accounts.

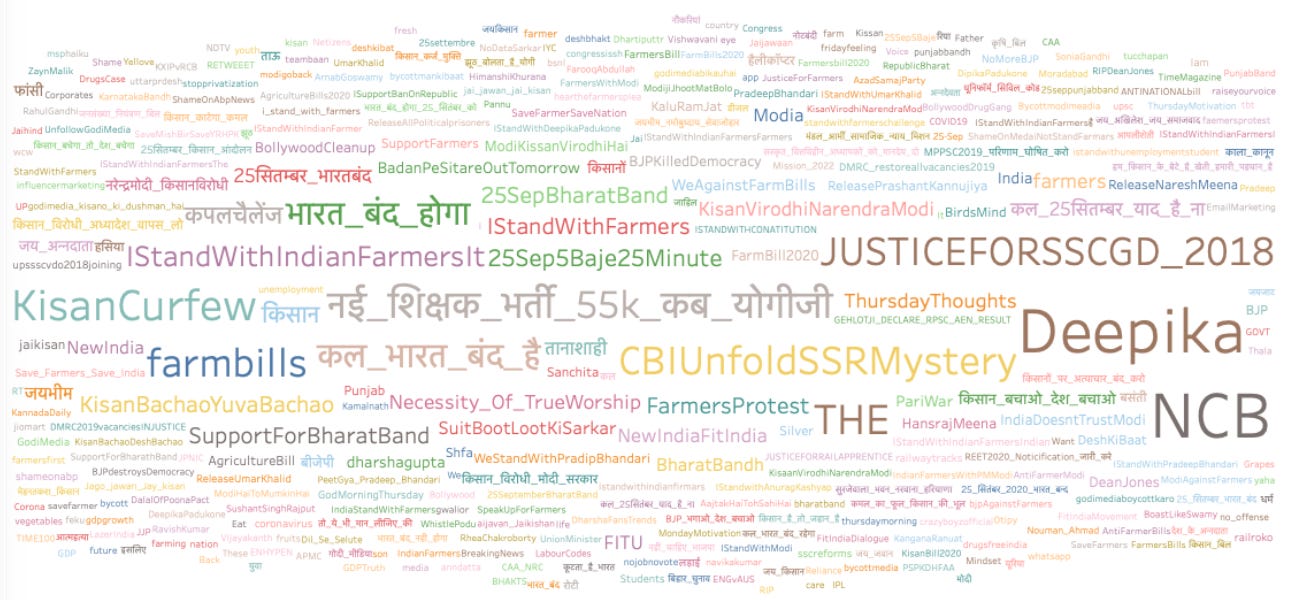
Over in the hashtag cloud, you can see references to CBIUnfoldSSRMystery, Deepika and NCB. I thought it was strange so I looked into those. Turns out, it was “mainly” content pointing to the likelihood of a distraction. There was disparaging content too.
Then, when I looked at the most active accounts. In the top 10, 2 of the accounts were from the Jul-Sep group. Others ranged from creation in dates in 2012 to 2019.
A word of caution here when looking at recent v/s overall tweets/day stats (something, I should have pointed out in previous editions to be honest), since it is an average, the overall number may skew lower due to periods of inactivity, low activity being bundled in. In general though, the related hashtag sections show activity mainly centered around one/two topics. The tweet composition varies a bit from the previous group with original tweets, quote tweets or replies in the mix - in most cases. Daily activity was in the 300 - 750 tweets/day range.


Love and other Drugs
The good folks at Tattle Civic Technologies have created a nifty dashboard that plots themes in fact-checked articles they scraped from IFCN certified websites.

It is interactive, but I’ll include a screenshot here for reference.

While an actor seems to occupy the top 2 slots, most of the others had an unfortunate communal angle to them. 3 of them (love, jihad and love_jihad) belonged to same cluster (7).

And, another 3 (Andhra, Pradesh and andhra_pradesh) belonged to clusters 5 and 6.


Professor Shakuntala Banaji and Ram Bhatwrote about religious discrimination in India during the pandemic. They’ve also published a study titled *Whatsapp Vigilantes* . It contains graphic examples, so, consider yourself warned if you plan to click through.
Meanwhile in India
Auqib Javeed writes for Article14 about Twitter Users in J&K who were ‘questioned’ by the cyber cell for anti government posts.
Labour Ministry retweets a bizarre post by Sonu Nigam about Deepika Padukone.
Kerala’s Chief Minister claims that measures to curb information disorder in the state will not affect media freedom.
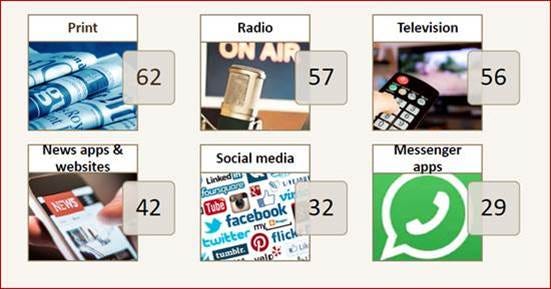
A surveyby Ormax media of 2400 urban news consumers showed that print media ranked higher than tv and social media based on a ‘credibility index’.
News Credibility Index: ‘% news consumers who don’t see fake news as a major concern’
Media Credibility Index: ‘% news consumers who find the news in a particular medium generally credible (among those consuming news in that medium)’
I found that State/UT illustration interesting (they covered 17 in their survey).

Oh, did you happen to catch which state has the highest news credibility as per the survey? Ok, good. Because as per this article by Himadri Ghosh, there has been a spurt in ‘propoganda-spewing’ websites and video channels. They identify 28 Youtube channels and 13 websites.
An interesting IANS release titled “AI reveals India successfully used nudge campaign to fight Covid” . As per this press release, a study by 2 Indian origin researchers analysed 400 press releases by the Indian Government. Ok, then.
Andhra Pradesh police launched an app that includes 87 services. Including, a fact-check feature “which one can utilise to find the authenticity of the news reports or the news being circulating on social media. The feature aims to curb the spread of fake news and messages.” I have to say I am ambivalent about this - Yes, there is role for the police to provide accurate information at certain times. However, does it have the capacity to act as a first-party fact-checker?
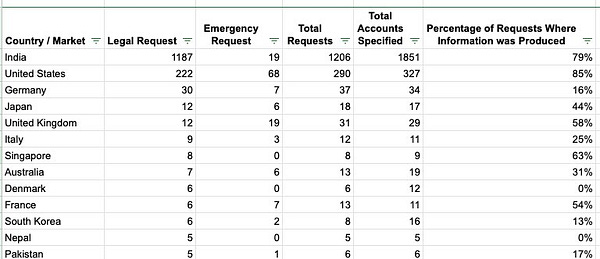
TikTok released its Transparency report for H1 2020. India had the most number of content removals, government requests for information and law enforcement for user information. Of course, you couldn’t access the report from India. But look at the bright side, there is a very good chance it won’t be on top when the H2 reports comes out.



Information Operations
Facebook removed 155 accounts, 11 pages, 9 groups and 6 Instagram accounts which they attributed to China, focussed on the Philippines, Southeast Asia and the U.S. One thing that strikes me is how small the numbers typically are - which indicates - how difficult attribution is, and throws up the question of the scale and effect of these takedowns.
Graphika published a report “Operation Naval Gazing”
its content reflected Chinese messaging, both overt and covert, on issues such as the Hong Kong protests, Taiwan’s independence, and COVID-19. Other content promoted China’s position in its geopolitical rivalry with the United States, especially in the South China Sea. The operation’s use of covert assets to promote favored politicians - notably members of the Duterte family in the Philippines, and President Joko Widodo (“Jokowi”) in Indonesia - appears more novel. Its use of fake American accounts was also novel, but these assets were generally too rudimentary to establish a persona.
The Stanford Internet Observatory documented a network of pages operated by Guinean president’s political party. They shared this information with Facebook, but the latter believed it did not meet the threshold for Coordinated Inauthentic Behaviour (emphasis mine).
We shared a draft of this blog post with Facebook, along with the underlying data. Facebook found that the Pages and accounts did not meet its threshold for coordinated inauthentic behavior, and the network has not been suspended.While the activity we found does not meet Facebook’s formal threshold for enforcement action such as removing the accounts or attaching a label to the Pages, we worry this activity is inconsistent with transparent political campaigning and fair democratic elections. The Guinea case raises broader questions about where and how to draw the line between modern political campaigning in the age of social media and [coordinated inauthentic behavior](https://slate.com/technology/2020/07/coordinated-inauthentic-behavior-facebook-twitter.html).
This dovetails with the Buzzfeed story on the 6600 word memo that a former employee posted internally spanning activity in India, Ukraine, Spain, Brazil, Bolivia, and Ecuador. Where I had 3 major takeaways:
The clear western world bias of enforcement.
The sheer haphazardness of internet processes (seemingly).
How PR risks drive priorities.
Aside: Just last week my colleagues at Takshashila (Manoj, Rohan) and I recorded a podcast on the lack of clear definition of Coordinated Inauthentic Behaviour. A point that Shannon Mcgregor recently raised in WIRED as well.


